| 閉じる | ||
| 【意匠に係る物品】財務諸表情報の表示画像 【意匠分類】N3−10W 【国際意匠分類】Loc(13)Cl.14−04 【Dターム】N3−10VNA 、 N3−10VCD 、 N3−10VDA 、 N3−10VLA 、 N3−10VBS 【創作者】 【氏名】石崎 善隆 【住所又は居所】大阪府堺市美原区小寺427番地13 【意匠権者】 【識別番号】521031523 【氏名又は名称】石崎 善隆 【住所又は居所】大阪府堺市美原区小寺427番地13 【代理人】 【識別番号】100134050 【弁理士】 【氏名又は名称】岩崎 博孝 【意匠に係る物品の説明】 画像図で表された画像は、表計算ソフトに入力された財務に関する数値データを、表計算ソフト画面上に表示するためのGUI表示画像である。特に地方公営企業法会計を前提としている。比例縮尺貸借対照表は、流動性配列法(1事業年度以内に債権が現金資金として待機状態となる「流動資産」と1事業年度以内に債務が償還期限を迎え,現金資金の支払いが求められる「流動負債」とを企業体の支払い能力を重視し,貸借対照表の資産・負債の冒頭から表示していく方法)により表示される。2時点比較比例縮尺貸借対照表は、事業年度の期首及び期末時点における貸借対照表の変化を図示した比例縮尺貸借対照表である。ここでは,同一縮尺により2時点の比例縮尺貸借対照表により,総資本の増減も大きさの変化によってとらえることができる。任意の2時点を採り,比較することにより,比例縮尺貸借対照表を並列的に配置することにより,財務諸表の利用者は,財務的構成要素の金額の時系列的な変化を四角形の大きさの変化として知覚することが可能となる。企業体間比例縮尺貸借対照表は、企業間における総資本の相違を貸借対照表の大きさの比較により明確に知覚することができる。P/L集合縦棒グラフは、「売上総利益」「営業利益」「経常利益」「純利益」の4者を正確に区別して明瞭に記載しなければならない点を考慮した表示となっている。P/L集合縦棒グラフは、選択した2つのP/L集合縦棒グラフを比較し易くするために並べて配置している。C/F期首・期末現金は、業務活動によるキャッシュ・フロー,投資活動によるキャッシュ・フロー及び財務活動によるキャッシュ・フローの関係、並びにそれに伴う期首・期末のキャッシュ・フローの関係が示される。 |
||
【画像図】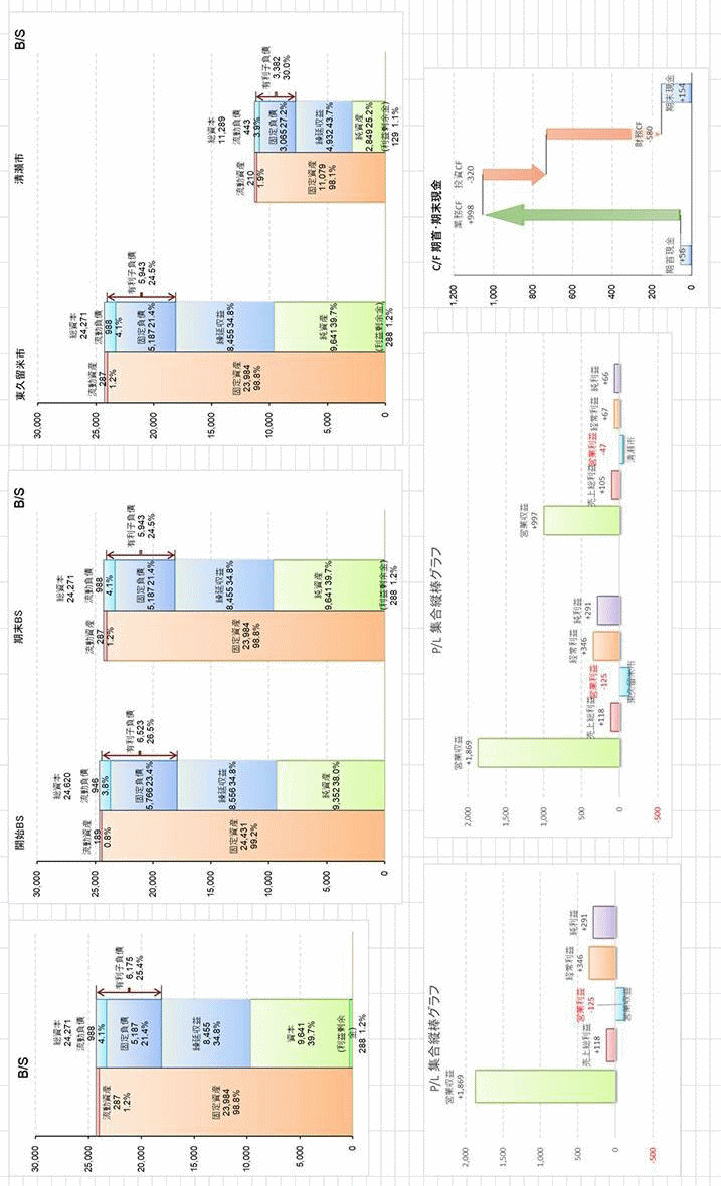 |
||
【各部の名称を示す参考画像図】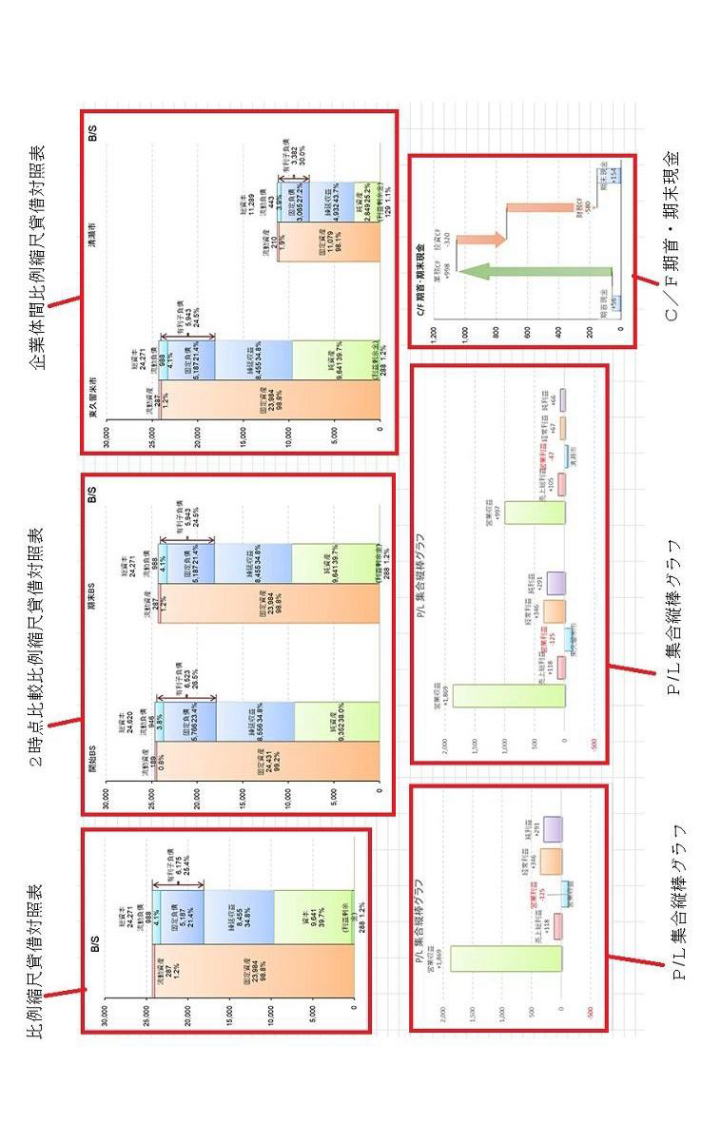 |
||
画像図で表された画像は、表計算ソフトに入力された財務に関する数値データを、表計算ソフト画面上に表示するためのGUI表示画像である。特に地方公営企業法会計を前提としている。比例縮尺貸借対照表は、流動性配列法(1事業年度以内に債権が現金資金として待機状態となる「流動資産」と1事業年度以内に債務が償還期限を迎え,現金資金の支払いが求められる「流動負債」とを企業体の支払い能力を重視し,貸借対照表の資産・負債の冒頭から表示していく方法)により表示される。2時点比較比例縮尺貸借対照表は、事業年度の期首及び期末時点における貸借対照表の変化を図示した比例縮尺貸借対照表である。ここでは,同一縮尺により2時点の比例縮尺貸借対照表により,総資本の増減も大きさの変化によってとらえることができる。任意の2時点を採り,比較することにより,比例縮尺貸借対照表を並列的に配置することにより,財務諸表の利用者は,財務的構成要素の金額の時系列的な変化を四角形の大きさの変化として知覚することが可能となる。企業体間比例縮尺貸借対照表は、企業間における総資本の相違を貸借対照表の大きさの比較により明確に知覚することができる。P/L集合縦棒グラフは、「売上総利益」「営業利益」「経常利益」「純利益」の4者を正確に区別して明瞭に記載しなければならない点を考慮した表示となっている。P/L集合縦棒グラフは、選択した2つのP/L集合縦棒グラフを比較し易くするために並べて配置している。C/F期首・期末現金は、業務活動によるキャッシュ・フロー,投資活動によるキャッシュ・フロー及び財務活動によるキャッシュ・フローの関係、並びにそれに伴う期首・期末のキャッシュ・フローの関係が示される。 |
||
| The picture shown on the figure is the GUI display picture in order to display data related to finance input in a table calculation software. It is premised especially as local public industrial accounts. As for the referring figure of renting proportional scale, such as current arrangement would be described as such, (1. This is the method of displaying the headline of assets and liabilities on balance sheet focusing on the solvency of an enterprise within a fiscal year where the debts are suspended as cash funds as “current funds”, and the debts come within one fiscal year, when it comes to the payment deadline and required to be paid as cash funds as “current debts”). Two points comparative proportional scale balance sheet is the one that shows the changes as figures of the begging of the term and the end of the term on the balance sheet. Due to simultaneous scale and two points proportional scale balance sheet, the increase and decrease of the total capital can be captured by the change of its scale. By taking any two points to be compared and allocating the proportional scale balance sheets on parallel, the users of financial statements will be able to perceive the change of the amount of financial composition elements that seems like chronical order as a change of a vast rectangular shape. As for the enterprise proportional scale balance sheet, the difference of total capital among enterprises can be explicitly perceived in the comparison of the scale of the balance sheet. P/L assembly vertical graph is the display that covers the points where it is needed to differentiate “Gross margin”, “Operating income”, “Ordinary profit”, and “Net profit” and describe them explicitly. P/L assembly vertical graph is arranged between two selected P/L assembly vertical graph so that they can be compared easily. C/F cash of the beginning and the end of the terms shows the relation of cash-flows regarding business activities, investment activities, and financial activities along with the begging and the end terms of cash-flow. | ||
| ページtop へ | ||